High-Performance Computing (HPC) and Virtual Desktop Infrastructure (VDI) and Sync Infrastructure (SyncInfra) are technologies that, when combined, can offer immense power and flexibility for computational tasks. However, as these systems become more integrated and sophisticated, managing and optimizing their performance can be challenging. This is where reports and analytics come into play. In this blog, we’ll explore how reports and analytics can enhance these environments. However, managing such an environment requires a keen understanding of how resources are being utilized and where improvements can be made.
Let’s Understand how reports and analytics are important and how the inputs are provided:
Reporting and Analytics: Reports and Analytics discover patterns and insights of computing system. The advent of high performance computing , Infrastructure and analytics create the ability to interrogate extremely large data sets in real time. Reporting and analytics are both important processes that businesses use to assess their performance. Taking about these three environments HPC, VDI and Infra, they work on different reporting and analytics Like HPC works on Jobs , Node & Storage, VDI works on Sessions & Users and Infra works on Nodes.
Reports and analytics play a crucial role in managing and optimizing environments.
Report generation and analysis are crucial for interpreting simulation results and making informed engineering decisions. It enables engineers to simulate and analyze how products and systems will perform under various conditions, optimize designs, and predict potential issues. These requirements are send by the Users and with different priority level. As, we can see in the images above how tools collect and compile data from simulations, Engineers can generate customized reports that include charts, graphs, and tables to present findings clearly. Reports document the simulation setup, including boundary conditions, material properties, and modeling assumptions. This helps ensure transparency and reproducibility of results. where the The analysis evaluates whether the design meets performance criteria. on analysis results, engineers make design modifications to improve performance, reduce weight, enhance durability, or lower costs. Optimization algorithms can automate part of this process. Engineers may perform sensitivity analysis to determine how variations in design parameters affect performance. This helps in understanding the robustness of the design.
Reports can track CPU, GPU, memory, and storage usage across the environment. Analytics can help identify bottlenecks or underutilized resources, enabling more efficient allocation and optimization. Understanding usage patterns helps in balancing the load across the system. Reports can show peak usage times and help in scheduling maintenance or upgrades during off-peak hours. Also, Analytics can help identify unusual patterns or potential security breaches. Early detection of anomalies can prevent larger issues and enhance overall system security.
Collecting and analyzing feedback from users about their experience with these environment can provide valuable insights. Reports can highlight common issues or areas where user experience can be improved. Analytics can measure how well the virtual desktops are performing from a user’s perspective, including responsiveness and reliability.
HPC Deployment Graphs :
1) Job Summary
Representation of active jobs, it shows number of jobs currently running , number of jobs which
are queued because license or resource unavailability, and number of completed jobs.
2) Job Completed
Representation of all completed inactive jobs. It show how many jobs have failed, how many jobs
have cancelled and how many jobs have completed successfully.
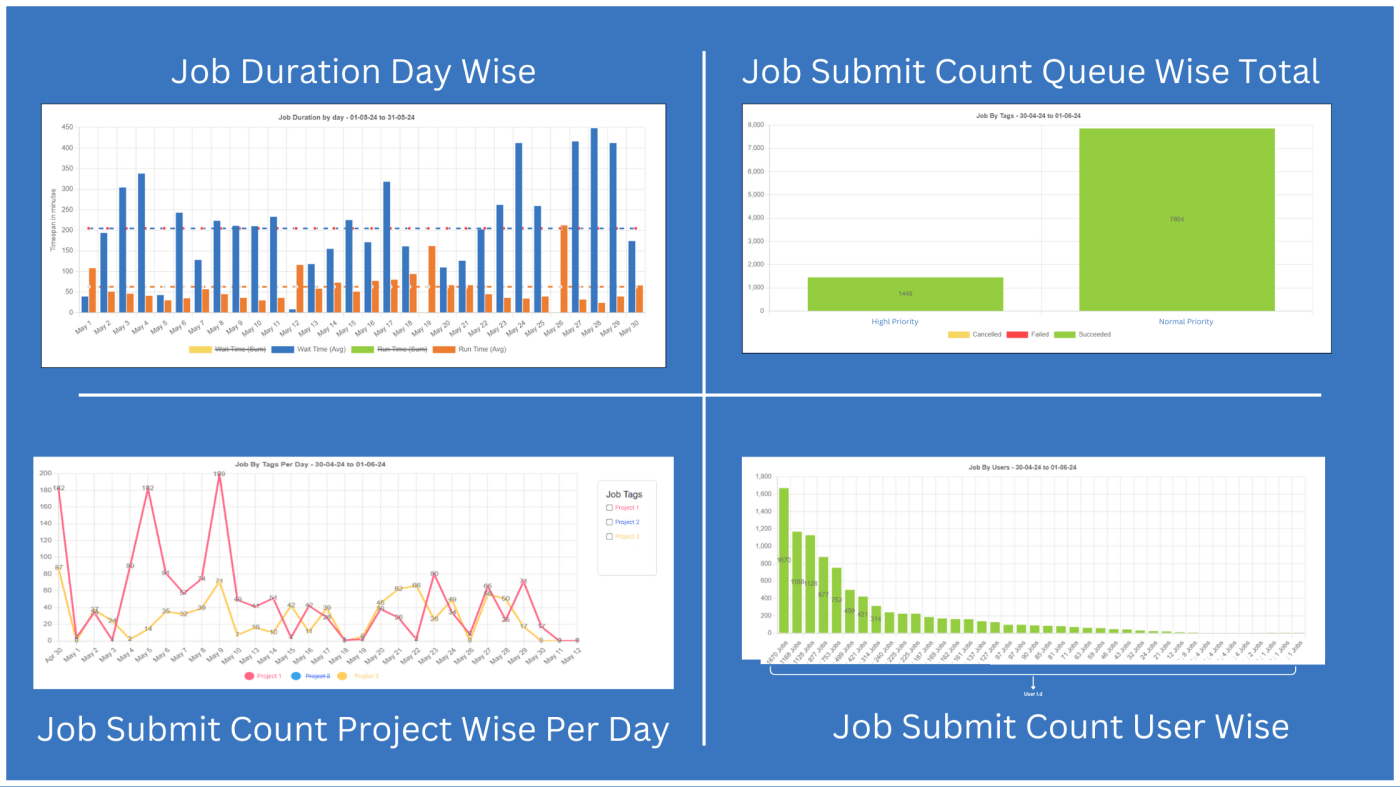
3) Job Submit Count
Graphical representation of number of jobs submitted per day. Along with average number of
jobs submitted per day for selected period. Also shows number of Succeeded, Cancelled and
Failed jobs per day.
4) Job By Application
Represents number of jobs submitted per application for selected period. Also shows number of
Succeeded, Cancelled and Failed jobs of each application.
5) Job By Nodes
Number of jobs submitted on each compute node. Also shows number of Succeeded, Cancelled
and Failed jobs on each node.
6) Job By Node Group
Number of jobs submitted on each compute node group (or partition). Also shows number of
Succeeded, Cancelled and Failed jobs on each node group (or partition).
7) Job Wait Time
Average time jobs have waited in each stage of job or for license and resource.
8) Job By Users
Number of jobs submitted by each user. Also shows number of Succeeded, Cancelled and Failed
jobs of each user.
9) Job By Groups
Number of jobs submitted by each user group. Also shows number of Succeeded, Cancelled and
Failed jobs of each user group.
10) Job By Tags
Number of jobs submitted under each Tag. Also shows number of Succeeded, Cancelled and
Failed under each tag.
11) Storage Usage
Storage usage in GB per day.
12) Cores By Application
Number of cores used by each application to run jobs.
13) Core Hours By Users
Total core hours used by each user.
14) Core Hours By Groups
Total core hours used by each user group.
15) Average Core Usage
Number of cores which are Free/In Use/Stopped.
16) Node Availability
Number of busy, available and unavailable nodes per day.
17) Average Node Utilization
Average CPU, RAM, GPU and GPU RAM utilization of all nodes in cluster combined.
18) Single Node Utilization
CPU, RAM, GPU and GPU RAM utilization of node.
19) Prime – Non Prime Core Usage
Usage of cores in office/non-office hours.
20) Utilization By Noe Group
CPU, RAM, GPU and GPU RAM utilization of nodes in node group (or partition).
21) HPC Units Consumed
Number of HPC units consumed per day.
22) CPU Usage By Nodes
Average CPU usage by each node (in percentage) for selected period.
23) CPU Usage By Node Groups
Average CPU usage by every node (in percentage) grouped by node group for selected period.
24) Core Usage By Nodes
Average core usage by each node (in percentage).
25) Core Usage By Node Groups
Average core usage by every node (in percentage) of each node group.
26) Job Duration By Day
Total Run and Total Wait Time (in minutes) of all jobs on each day.
VDI Deployment Graphs :
27) User Session
Active session of selected user and its active and disconnected session time.
28) Active Sessions
Number of active vdi sessions.
29) All User Sessions
Time for which each user has active session on any workstation.
30) Node Start/Stop Status
Time for which each node is in active state and inactive state.
Conclusion :
In the world of HPC, VDI reports and analytics are not just tools for monitoring; they are essential for optimizing performance, managing costs, ensuring security, and enhancing user experience. By effectively leveraging these insights, organizations can maximize the benefits of their HPC, VDI environments, driving innovation and efficiency in their computational tasks. Whether you’re managing a large-scale research facility or a dynamic enterprise environment, a strategic approach to reporting and analytics can provide a competitive edge and drive success.

Leave a comment