Running a large CFD or structural simulation on an HPC cluster is only half the battle. The other half actually seeing what the solver produced has historically meant downloading multi-gigabyte result files, installing heavyweight desktop tools, and spending time setting up a local visualization environment before you can look at a single rendered frame.
For engineering teams working at scale, this creates a real bottleneck. Result files from Ansys Fluent, LS-DYNA, OpenFOAM, or Nano-Fluid-X can exceed tens of gigabytes. Transferring them over VPN just to open ParaView on a laptop is slow, fragile, and puts visualization burden on workstations that were never designed for it. Cluster compute power sits idle while engineers wait for downloads.
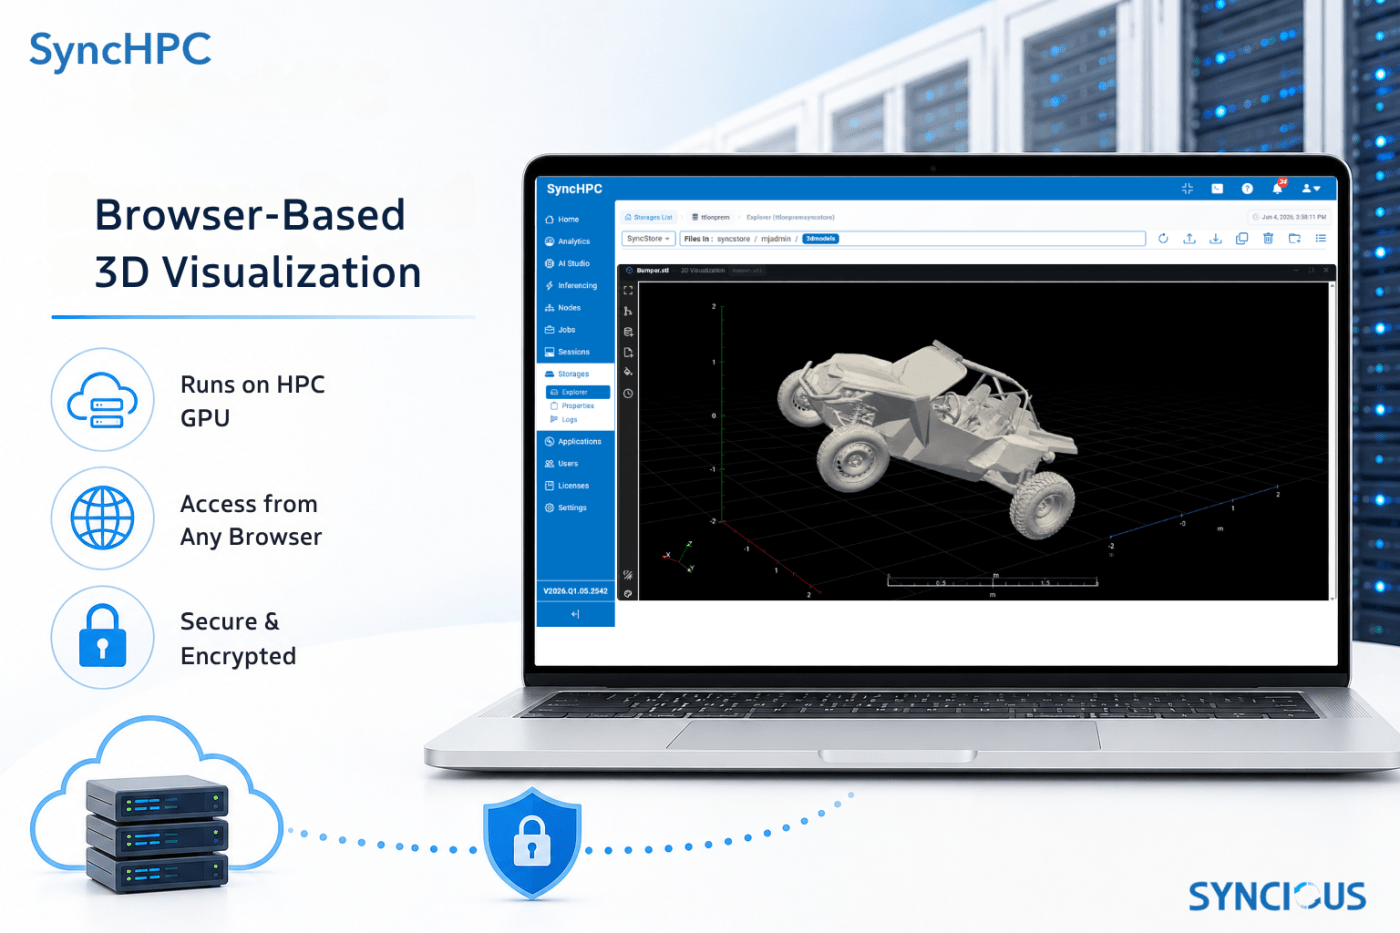
SyncHPC now solves this with a built-in 3D Visualization feature that lets you open simulation results directly in your browser no local install, no file transfer, no waiting, enabling engineers to explore CFD and FEA results directly from the HPC cluster.
How It Works
The 3D Visualization feature is built around ParaView the industry-standard scientific visualization platform running directly on the HPC node where your results live. When you click the Visualize button on a completed job, SyncHPC spawns a dedicated ParaView rendering session on the server, streams the rendered output to your browser over WebSocket, and tears it down cleanly when you close the viewer.
The key architectural insight is that the simulation data never moves. ParaView reads the result file in-place from the workstore, renders it using the node’s NVIDIA GPU, and sends only the rendered JPEG frames to your browser. A multi-gigabyte Fluent .cas.h5 file stays on the cluster. What crosses the network is a live interactive video stream typically a few megabits per second, the same as a video call.
What You Can Visualize
The viewer supports the full range of simulation output formats used across HPC workflows. You do not need to pre-convert results or change your solver configuration.
Supported formats include:
Ansys Fluent — .cas, .cas.h5, .dat, .dat.h5
LS-DYNA — d3plot and the full part-file family (d3plot01, d3plot10, etc.)
OpenFOAM — .foam case files
Nano-Fluid-X — .h5part, .xdmf, .xmf
EnSight Gold — .case, .encase
VTK formats — .vtu, .vtp, .vtk, .pvd, .vtm, .vts, .vtr
Geometry — .stl, .obj
One detail worth calling out: LS-DYNA solvers often write part files with non-sequential suffixes (d3plot10, d3plot20, …) when the output interval is greater than one. Standard ParaView readers expect a contiguous sequence and silently find nothing, resulting in empty viewers. SyncHPC automatically detects this pattern and creates the sequential file links that the reader needs no manual workaround required.
When you pass a job directory rather than a specific file, SyncHPC scans the directory and opens the most recently modified supported result file automatically, with a visible indicator in the viewer title so you always know what you are looking at.
The Viewer Interface
The In-browser viewer is a full-featured scientific visualization interface built on ParaView Trame ParaView’s modern web UI framework. It gives you the same interaction model as the desktop ParaView application, delivered entirely through the browser.
Available controls include:
(i) Representation modes — Surface, Surface With Edges, Wireframe, Points
(ii) Camera axis presets — +X, -X, +Y, -Y, +Z (Top), -Z (Bottom), and Isometric views
(iii) Reset camera — Fit the entire geometry to the current view in one click Perspective / Orthographic projection
toggle
(iv) Scalar bar (color legend) — Toggle the color scale overlay on or off
(v) Pipeline browser and filters — Add Contour, Slice, Clip, Warp by Vector, and other ParaView filters interactively
(vi) Color-by controls — Switch which result array drives the colormap and choose the colormap itself
VCR time controls — Play, pause, and step through time for animated results (d3plot time series, PVD collections, OpenFOAM transient runs)
The viewer runs entirely server-side. ParaView renders on the NVIDIA GPU in the compute node using EGL offscreen rendering, no X display server, no VirtualGL, no graphics card required on the client machine. A browser is all you need.
Format Conversion for Non-Native Formats
For simulation outputs that ParaView does not read natively specifically Altair H3D (OptiStruct) and LS-DYNA keyword mesh files (.k, .key, .dyn) SyncHPC includes a built-in conversion utility that produces standard VTK files the viewer can open directly.
Altair H3D files are handled entirely in pure Python without needing ParaView at all, which avoids the several-second startup overhead. The converter reverse-engineers the binary H3D format, extracts node coordinates, stress tensors (Sigma_XX, Sigma_YY, Sigma_ZZ, Sigma_XY, Sigma_YZ, Sigma_XZ, Von Mises), and displacement vectors, and writes a fully annotated .vtu point cloud. LS-DYNA keyword decks are parsed for node positions and element connectivity across solid, shell, and beam element types, and written as a proper VTK UnstructuredGrid.
Converted files are written in binary VTK XML format with ZLib level 6 compression, A balance that keeps file sizes manageable without sacrificing write speed on large meshes.
Infrastructure: What Runs on the Node
The feature is delivered by three tightly integrated components running on the HPC visualization node:
Paraview-service is a Go HTTP/WebSocket server that manages the entire session lifecycle acquiring ports, spawning pvpython processes, proxying browser traffic, and cleaning up on close or idle timeout. All communication happens over HTTPS with TLS, so the viewer is accessible securely from any browser on the network.
ParaView 6.0.1 with the bundled pvpython interpreter provides the actual rendering engine.
Trame (specifically paraview-trame-components) provides the interactive web UI layer. It runs inside the pvpython process and serves the viewer assets over HTTP on a localhost-only port. The Go service proxies everything through one public-facing port the browser never connects directly to any internal Trame instance.
A Real Workflow Example
An engineer submits an Ansys Fluent simulation of a heat exchanger from the SyncHPC job interface. The solver runs on 32 cores and writes its results to /mnt/workstore/job_1247/. When the job finishes, the engineer clicks Visualize directly from the job status page.
User finds result.cas.h5 in Output Directory as the latest supported file, and opens the 3D viewer in a dialog. Within seconds the engineer is looking at a colored pressure contour plot of the full geometry, rendered on the server GPU. They rotate the model, add a Slice filter to inspect the internal flow channels, switch the color array to velocity magnitude, and toggle the scalar bar. All of this happens in the browser, in real time, without downloading a single file.
When they close the viewer, the session is cleaned up, the port is freed, and the cluster is ready for the next job.
What’s Next
The 3D Visualization feature in SyncHPC is already in production for Fluent and LS-DYNA workflows. Upcoming iterations will extend support for additional solver formats, introduce collaborative viewing for engineering teams, and add annotation and snapshot export directly from the viewer interface.
If your team is spending time on result transfer and local visualization setup today, SyncHPC’s built-in viewer eliminates that overhead entirely. Simulation results are available for interactive exploration the moment the job finishes on any machine, from any browser, with no local software required.
SyncHPC is a workload management and visualization platform built for HPC environments. To learn more or schedule a demo, visit syncious.com.

Leave a comment