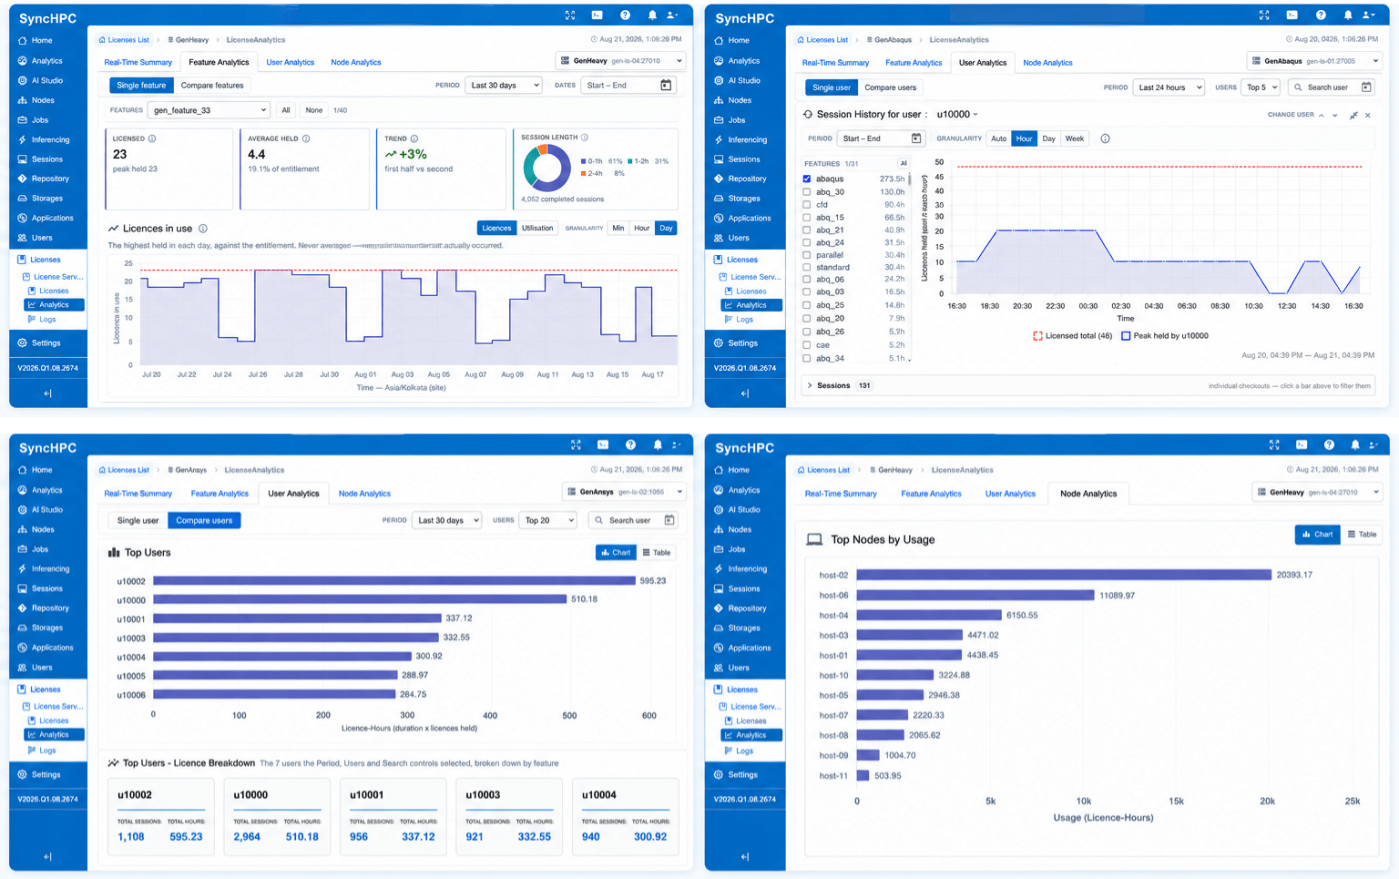
A new way to see how your CAE license pool is actually being used by product, or by user.
Every checkout against your license servers is already logged somewhere in lmgrd, in the vendor daemon, in a debug file nobody opens until something breaks. The data has always existed. What’s usually missing is a way to look at it without grepping through flat files during a renewal negotiation.
SyncHPC already watches your license servers in real time to keep jobs running and catch contention before it stalls a queue. License Analytics takes that same stream and turns it into a record of what was held, by whom, and when going back as far as the watch has been running.
Two ways in
License questions rarely start from the same place twice. Sometimes you’re chasing a product: why does Abaqus keep queuing on Tuesday afternoons? Sometimes you’re chasing a user: what are they actually costing us across everything they run? License Analytics gives you both entry points.
By feature. Pick a single product, or switch to Compare features to line several up side by side. Either way, you get:
- Licensed capacity against the peak actually held
- Average held, both as a count and as a percentage of entitlement
- A trend comparing the first half of the period to the second, so demand climbing shows up before it’s a problem
- A session-length breakdown showing where most checkouts fall, with outliers highlighting unusually long-held licenses.
- A daily peak-vs-entitlement view showing usage below 70%, 70–89%, and 90%+ of entitlement
- A queued-and-refused log checkouts that had to wait, or got turned away outright
This is the view for capacity questions, not guesses.
By user. Flip the axis and the same dashboard follows a user instead of a feature. Everything they checked out, across every feature they touched, in one place. Abaqus in the morning, an OptiStruct DDM run that ran into the evening, a license held from a machine nobody’s looked at in days. This is the view for chargeback, audits, and the simple question: who used what, and when?
There’s a third angle too, for when the question isn’t which feature or which user but which machine: Node Analytics ranks compute nodes and workstations by how much license time they’ve pulled, so a spike traces back to a host, not just a user or a product.
What it actually answers
Put the views together and a few questions that used to mean a support ticket and a log dive get much faster:
- Are we really out of licenses, or is something stuck? A finished job still holding a token looks identical to real demand until the peak-vs-entitlement chart shows you which one it is.
- What do we need at renewal? Peak held against entitlement, plus the trend line, beats a guess based on complaints.
- Who’s driving the cost, and from where? Per-user consumption across features, cross-checked against Node Analytics, turns chargeback into a query instead of a spreadsheet reconciliation.
Built on what SyncHPC already does
This isn’t a new integration bolted on top. License Analytics runs on the same license-server watch SyncHPC already performs no extra agents, nothing new to poll for. If SyncHPC is tracking your FlexLM-based pool today, the history is already accumulating, sliceable down to the minute or rolled up to the week. License Analytics is just the view into it.
License usage is one of those things every HPC team half-knows and nobody can answer precisely on demand. License Analytics closes that gap, from any angle, for as far back as the watch has been running.


Leave a Reply